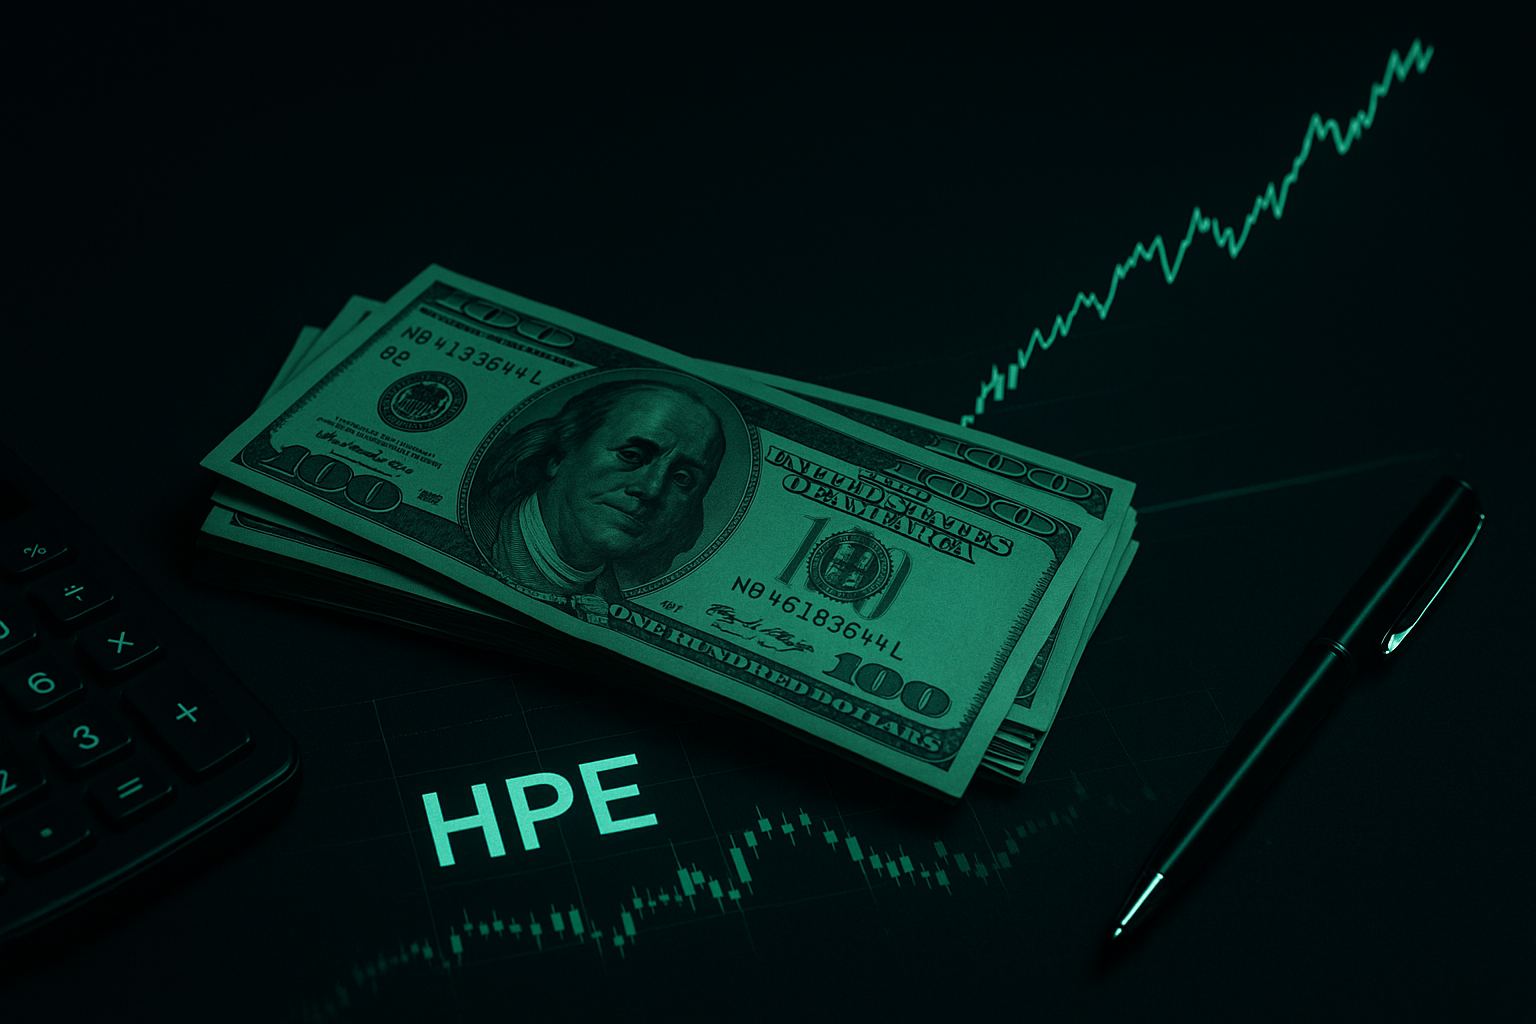

HPE AI Price Prediction
Track HPE's AI-powered predictions, market trends, and investment insights.
Mock Tradesimulated, no real money
You don't hold HPE in your mock portfolio yet.
Track HPE's AI-powered predictions, market trends, and investment insights.
You don't hold HPE in your mock portfolio yet.
Upgrade to see the full Evidence Stack
What Changed, Why Now, and Risk Flags — available on the Investor plan and above
Get StartedWith EPS of 1.07 and a PE ratio of 43.73 at the current price, Hewlett Packard Enterprise is trading at a valuation that implies high future growth relative to its recent earnings power. Without detailed recent revenue and margin data, the current earnings profile looks solid but not strong enough on its own to fully justify the sharp re-rating, suggesting expectations are elevated. Overall, fundamentals appear stable but not clearly improving fast enough to be outright bullish at this valuation.
The stock has surged 41.4% in the last month and now trades far above its 200-day moving average of $25.54, indicating a very strong uptrend but also a potentially overextended move. The rich PE multiple and sharp deviation from the long-term average suggest heightened risk of volatility or a pullback, even if the long-term trend remains positive. Overall, price action is technically strong but tactically stretched.
Web traffic at roughly 6.17 million monthly visitors indicates substantial ongoing customer and partner engagement, but no growth trend is provided to confirm acceleration. Job openings are flat month over month, and social media follower counts are large but growing only modestly, pointing to a stable rather than rapidly expanding commercial footprint. Overall, alternative data are steady and supportive, but not strongly indicative of a breakout in underlying demand.
Hewlett Packard Enterprise’s stock reflects very strong recent momentum and a rich valuation multiple relative to current earnings, suggesting that expectations for future growth are high. Alternative data point to a stable, entrenched enterprise franchise rather than a sharply accelerating growth story, which tempers the recent price enthusiasm. Overall, the setup appears balanced: strong trend but elevated expectations, leading to a neutral stance on the stock at current levels.
Our AI Score rates companies on a scale from 0 to 10, based on alternative data points such as web traffic, app downloads, and job postings — combined with financial health indicators and technical signals.


Hewlett Packard Enterprise (HPE) is under significant pressure in 2026, with shares trading at $49.20 after a sharp 8.4% single-day decline — a move accompanied by elevated trading volume of over 35.7 million shares. That volume spike suggests institutional-level activity, whether profit-taking, a news-driven sell-off, or portfolio rebalancing. With a market cap of $65.2 billion, HPE remains a large-cap infrastructure and server solutions player, but the size of this one-day move raises immediate questions about near-term momentum and whether the selling pressure has been fully absorbed.
TrendEdge's AI model currently assigns HPE a score of 4 out of 10 — a below-average reading that places the stock in cautious territory. This score reflects a combination of weak short-term price momentum following the 8.4% daily drop and elevated volume that may indicate distribution rather than accumulation. AI scoring at TrendEdge weighs technical signals, volume patterns, and sentiment data collectively. At 4/10, the model does not identify a strong bullish setup at this time. Traders and investors should treat this score as a signal to wait for stabilization before considering new long positions.
Looking ahead, key catalysts for HPE include enterprise demand for its server infrastructure, AI-optimized compute products like HPE Apollo and Cray systems, and its positioning in hybrid cloud. However, the immediate risk is follow-through selling after the 8.4% session drop. Watch for volume normalization and whether the $49 level holds as support. Any guidance revision or earnings update in 2026 could be a decisive inflection point for the stock's recovery trajectory.
Unlock comprehensive alternative data signals to make better investment decisions
TrendEdge provides tools and data for research and educational purposes only and does not provide investment advice or personal recommendations.
Web Traffic
6,171,962
Twitter Followers
92,515
Instagram Followers
67,998
YouTube Subscribers
24,400
LinkedIn Followers
3,772,982
Job Postings
1,000
LinkedIn Employees
90,099
News Mentions
0
Key Metrics