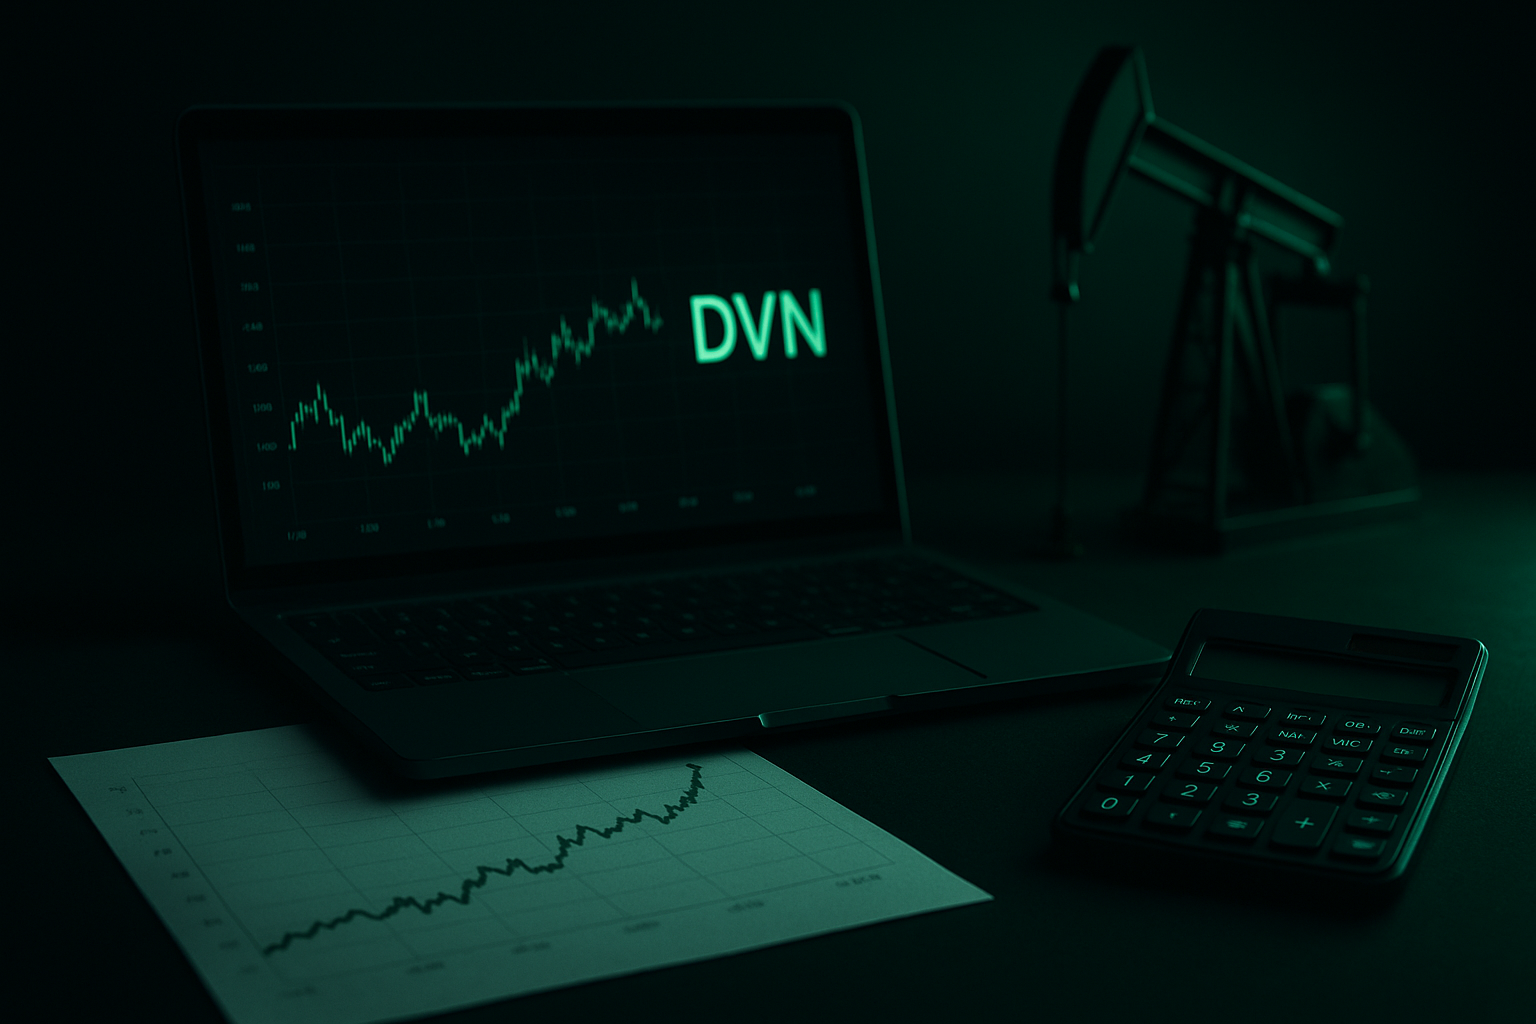

Why Devon Energy Stock Rallied Today
. fool.com
Track DVN's AI-powered predictions, market trends, and investment insights.
You don't hold DVN in your mock portfolio yet.
Upgrade to see the full Evidence Stack
What Changed, Why Now, and Risk Flags — available on the Investor plan and above
Get StartedWith EPS of 3.59 and a PE ratio of 12.33, Devon Energy appears reasonably valued relative to its earnings, suggesting neither clear overvaluation nor deep distress. The profitability metrics implied by EPS and PE are consistent with a mature, cyclical energy company whose earnings are heavily driven by commodity prices. In the absence of detailed revenue and margin trends, the data points to stable but not clearly accelerating financial performance.
At $44.28, Devon Energy trades modestly above its 200‑day moving average of $40.12, indicating the longer‑term trend is still intact despite a 5.2% pullback over the last month. The recent decline suggests short‑term selling pressure or consolidation, but price remaining above the 200‑day MA points to underlying support. Without an extreme overbought/oversold RSI provided, the technical picture looks mixed but not decisively negative.
Alternative data for Devon Energy show soft engagement and growth signals. Website traffic is modest at an estimated 19,628 visitors per month, and job openings have fallen to 6, down 40% month over month, which can indicate slower expansion or increased cost discipline. Social media followings are sizable, especially on LinkedIn, but growth has been flat to minimal across platforms, suggesting limited incremental investor or public engagement.
Overall, Devon Energy’s stock setup appears neutral. Earnings and valuation are reasonable, and the price remains above its 200‑day moving average despite a recent pullback, but alternative data show weak growth in hiring, web traffic, and social engagement. The balance of stable financials and technicals against soft alternative indicators suggests a wait‑and‑see stance rather than a strongly bullish or bearish view.
Our AI Score rates companies on a scale from 0 to 10, based on alternative data points such as web traffic, app downloads, and job postings — combined with financial health indicators and technical signals.
Why Devon Energy Stock Rallied Today


Devon Energy Provides Updated 2026 Outlook

Devon Energy (DVN) is currently trading at $44.49 on the NYSE, posting a modest intraday gain of 0.9% with volume exceeding 11.7 million shares — a sign of active institutional and retail participation. The company carries a market capitalization of $27.6 billion, positioning it as a mid-to-large cap player in U.S. oil and gas exploration and production. Operating approximately 5,134 gross wells across domestic basins, Devon's operational scale underpins its relevance as a pure-play U.S. E&P name in an energy market sensitive to crude price movements and production discipline.
TrendEdge's AI model assigns DVN a score of 6 out of 10, reflecting a cautiously constructive but not strongly bullish outlook. The score suggests the stock presents moderate upside potential balanced against meaningful uncertainties. With only 5 active job postings recorded, Devon is not in an aggressive expansion phase, which may indicate capital discipline or operational consolidation — factors the AI model weighs alongside price momentum and market sentiment. The 0.9% single-day price gain contributes a mild positive momentum signal, though the absence of broader 7-day trend data limits near-term directional confidence in the current model output.
Looking ahead, the key catalysts for DVN in 2026 center on crude oil price trajectory, U.S. basin productivity, and free cash flow generation relative to its variable dividend framework. Risks include commodity price volatility, regulatory shifts affecting domestic drilling, and any deterioration in balance sheet metrics. The low social media footprint — just 8 Reddit mentions in the past week — suggests DVN is not a high-retail-attention name right now, which can cut both ways: lower speculative froth but also reduced near-term momentum from retail flows.
Unlock comprehensive alternative data signals to make better investment decisions
TrendEdge provides tools and data for research and educational purposes only and does not provide investment advice or personal recommendations.
Web Traffic
28,832
Twitter Followers
15,258
LinkedIn Followers
297,023
Job Postings
6
LinkedIn Employees
5,657
News Mentions
0
Key Metrics