DE AI Price Prediction
Track DE's AI-powered predictions, market trends, and investment insights.
Mock Tradesimulated, no real money
You don't hold DE in your mock portfolio yet.
Track DE's AI-powered predictions, market trends, and investment insights.
You don't hold DE in your mock portfolio yet.
Upgrade to see the full Evidence Stack
What Changed, Why Now, and Risk Flags — available on the Investor plan and above
Get StartedWith an EPS of 17.64 and a PE ratio of 32.74, Deere & Company is priced at a premium relative to many traditional industrial and machinery peers, implying the market expects solid, sustained earnings power. However, without explicit revenue and margin trend data, the valuation looks more growth- and cycle-expectation driven than clearly supported by visible acceleration in fundamentals. Overall, the earnings profile appears strong but largely priced in, warranting a neutral stance.
At $577.48, Deere & Company is trading meaningfully above its 200-day moving average of $525.37, indicating a positive intermediate-term trend and underlying technical strength. The 2.8% gain over the last month is constructive but not extreme, suggesting a steady grind higher rather than a euphoric breakout. Without a specific RSI reading, the setup looks technically healthy but not clearly oversold or overbought, supporting a neutral-to-constructive view.
Alternative data for Deere & Company show broadly positive engagement and operational signals. Web traffic is sizeable, job openings have ticked up, and social media followings are growing across most major platforms, indicating stable-to-improving brand engagement and likely continued investment in growth and capabilities. These trends collectively lean bullish as they suggest healthy customer interest and corporate confidence.
Deere & Company’s stock exhibits solid technical strength and healthy alternative data signals, but its elevated valuation tempers the upside case. The business appears fundamentally strong and well-engaged with customers and talent, yet much of this quality and growth potential seems already reflected in the current share price. Overall, the risk/reward profile looks balanced, leading to a neutral stance on the stock at present levels.
Our AI Score rates companies on a scale from 0 to 10, based on alternative data points such as web traffic, app downloads, and job postings — combined with financial health indicators and technical signals.
Deere: The Hard Part May Already Be Over
Deere Beats Q2 Estimates, But Ag Weakness Weighs on Outlook
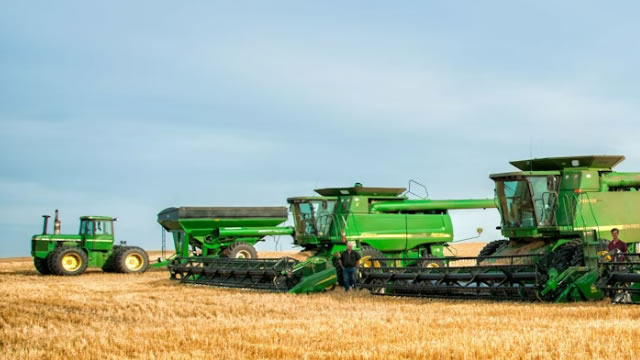
Deere & Company (DE) is currently trading at $583.44 on the NYSE, pulling back 1.4% in the latest session with volume of approximately 1.75 million shares. The company commands a substantial market capitalization of $157.5 billion, reflecting its dominant position across agricultural and construction machinery globally. DE operates through four core segments — Production and Precision Agriculture, Small Agriculture and Turf, Construction and Forestry, and Financial Services — giving it diversified revenue exposure across multiple capital equipment cycles. The session decline warrants attention, though it remains within normal volatility ranges for a large-cap industrial name of this scale.
TrendEdge's AI model assigns DE a score of 6 out of 10, indicating a moderately constructive but not decisively bullish signal. A score at this level typically reflects a balanced mix of positive fundamentals offset by near-term uncertainty in demand or macro conditions. For Deere, the active job postings count of 225 suggests the company is maintaining operational momentum rather than aggressively expanding or contracting headcount — a neutral-to-mild positive indicator. The AI model weighs factors including price momentum, fundamental positioning, and alternative data signals. At 6/10, DE sits in a watchlist-worthy but not high-conviction buy zone.
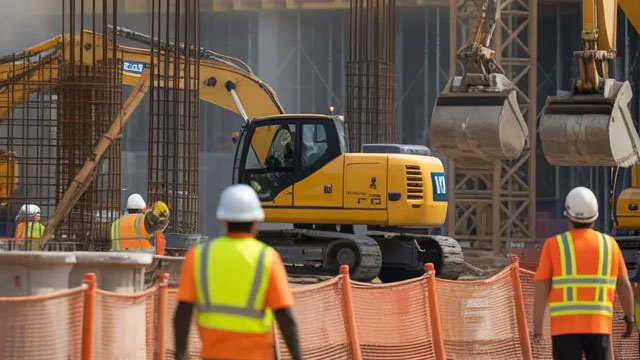
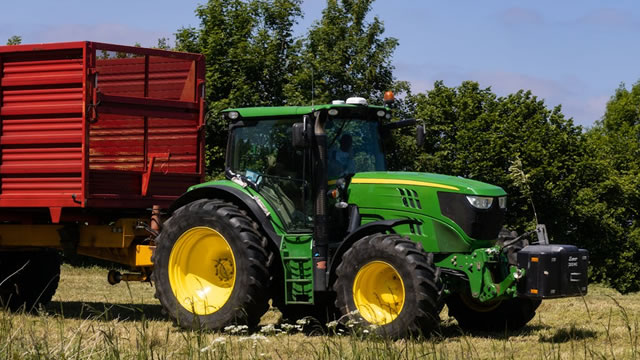
Looking ahead in 2026, the key catalysts for DE center on global agricultural commodity prices, farm income trends, and the pace of precision agriculture technology adoption — areas where Deere has invested heavily. Risks include softening equipment demand if farmer profitability compresses, rising input costs, and potential exposure to trade policy shifts affecting export markets. The Construction and Forestry segment adds cyclical sensitivity to infrastructure spending. Investors should monitor quarterly order books and guidance updates closely, as these will be the primary drivers of any re-rating from the current AI score.
Unlock comprehensive alternative data signals to make better investment decisions
TrendEdge provides tools and data for research and educational purposes only and does not provide investment advice or personal recommendations.
Web Traffic
5,179,077
Twitter Followers
231,672
Instagram Followers
1,608,048
YouTube Subscribers
409,000
LinkedIn Followers
1,842,318
Job Postings
215
LinkedIn Employees
53,696
News Mentions
0
Key Metrics