XLK AI Price Prediction
Track XLK's AI-powered predictions, market trends, and investment insights.
Mock Tradesimulated, no real money
You don't hold XLK in your mock portfolio yet.
Track XLK's AI-powered predictions, market trends, and investment insights.
You don't hold XLK in your mock portfolio yet.
Upgrade to see the full Evidence Stack
What Changed, Why Now, and Risk Flags — available on the Investor plan and above
Get StartedTechnology Select Sector SPDR (XLK) is an ETF, so its earnings profile (EPS 5.02, PE 36.51) reflects the weighted aggregate of its underlying technology holdings rather than a single company’s operations. The relatively high PE indicates investors are paying a premium for growth and quality in the tech sector, but it also implies sensitivity to interest rates and risk sentiment. Profitability, in aggregate, is strong for large-cap tech, yet valuations leave less margin of safety if growth slows.
With the price at $183.21 and a 200-day moving average of $147.90, XLK is trading well above long-term trend, indicating a strong, established uptrend. A 3.9% gain over the last month reinforces positive momentum rather than a short-lived spike. While the high PE suggests the ETF is not cheap, the technical setup remains supportive of a bullish bias as long as price holds above the 200-day moving average.
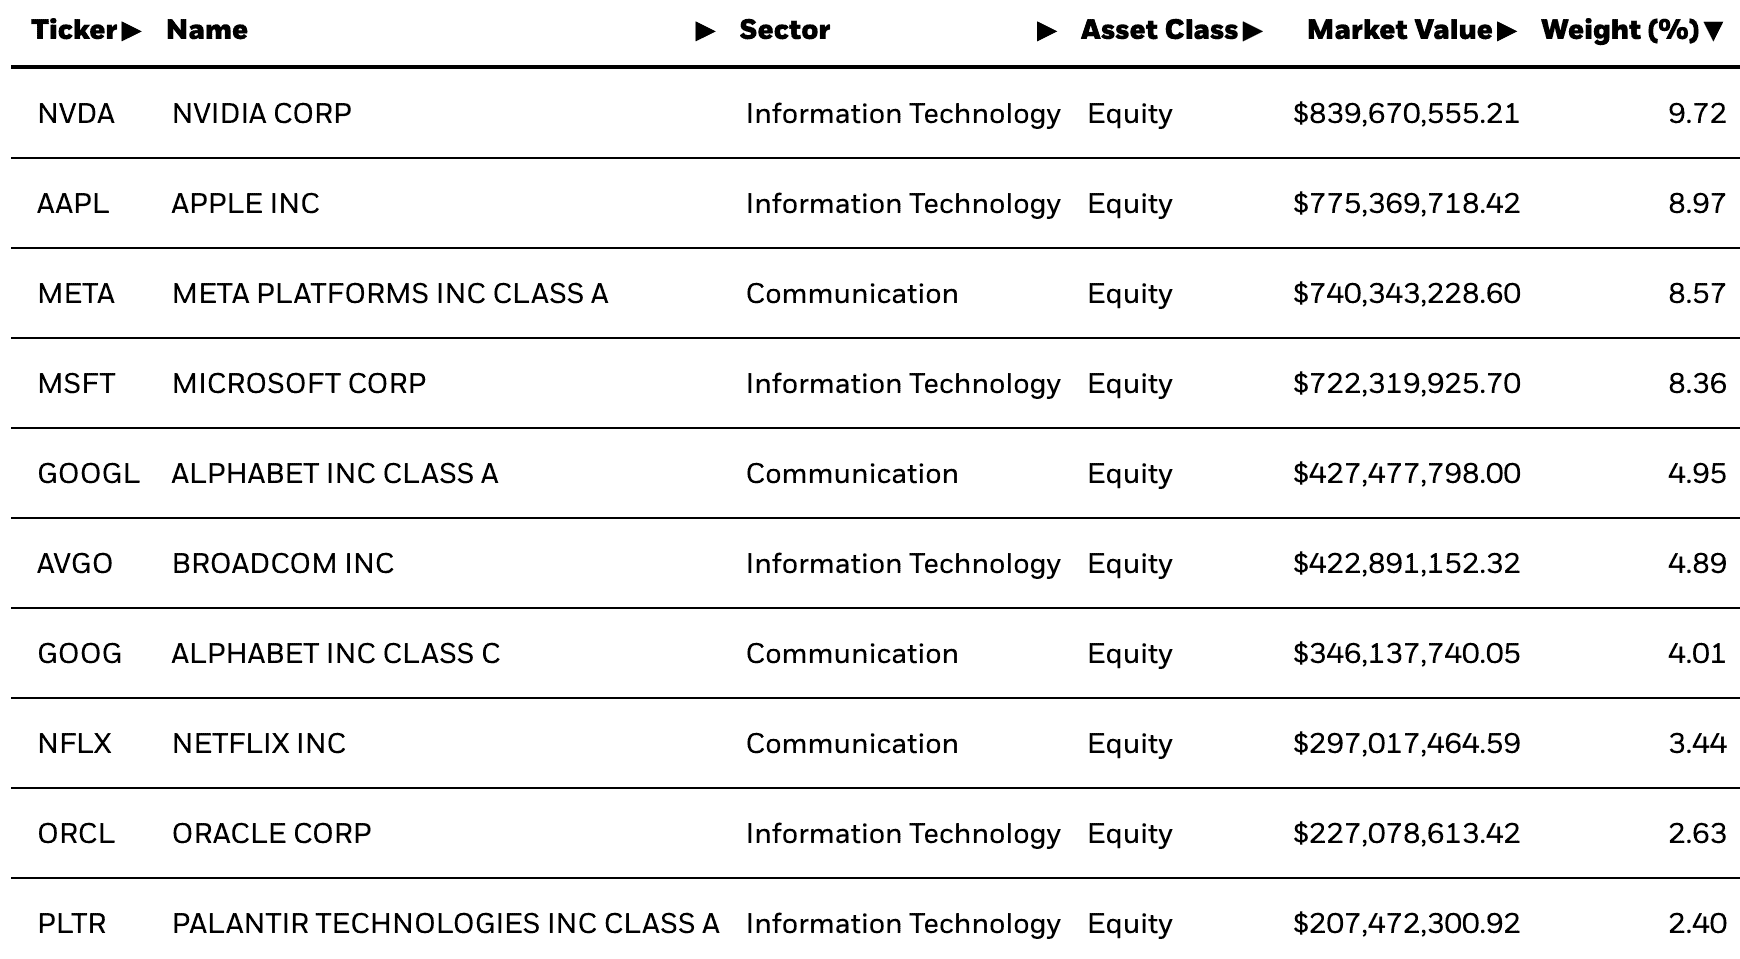
As an ETF, XLK’s performance is driven by the fundamentals and sentiment of its underlying tech constituents rather than its own direct operating metrics like website traffic or app downloads. Relevant alternative data would include hiring trends, product adoption, and sentiment for mega-cap names such as Apple, Microsoft, and other top holdings, which have generally shown resilient demand and strong ecosystems. However, without specific, current alternative data inputs, the net signal for XLK from these channels is best characterized as neutral to modestly positive.
The Technology Select Sector SPDR ETF exhibits a clearly bullish technical profile, with price meaningfully above its 200-day moving average and positive recent momentum. While the valuation (PE 36.51) is demanding and implies sensitivity to macro and rate shifts, the underlying tech sector’s earnings power and structural growth drivers remain supportive. Overall, the balance of evidence leans bullish, albeit with valuation-driven downside risk if growth expectations or risk appetite weaken.
Our AI Score rates companies on a scale from 0 to 10, based on alternative data points such as web traffic, app downloads, and job postings — combined with financial health indicators and technical signals.


XLK, XLE, or XLU? Building Your Sector Pairs

State Street Tech Sector ETF XLK Passes $100 Billion in AUM
Unlock comprehensive alternative data signals to make better investment decisions
TrendEdge provides tools and data for research and educational purposes only and does not provide investment advice or personal recommendations.
News Mentions
0